Sid Singaravel

Graduate Analytics @ Northeastern, MA
Previously, Data Science @ Fidelity, ZoomRx
Otherwise - cooks, runs, fantasy football.
📧 singaravel dot s at northeastern dot edu
LinkedIn | GitHub | Substack | Tableau
📄 View my résumé
Simulating the Two Chords Intersecting Problem
This Monte Carlo simulation explores the probability of two randomly drawn chords intersecting within a unit circle. The experiment generates random chords and determines whether they intersect, repeating this process 10,000 times to estimate the probability empirically.
Geometric Probability Unveiled: The Chord Intersection Challenge
This experiment delves into the fascinating realm of geometric probability, utilizing Monte Carlo methods to investigate a seemingly simple question: What is the likelihood that two randomly drawn chords in a circle will intersect?
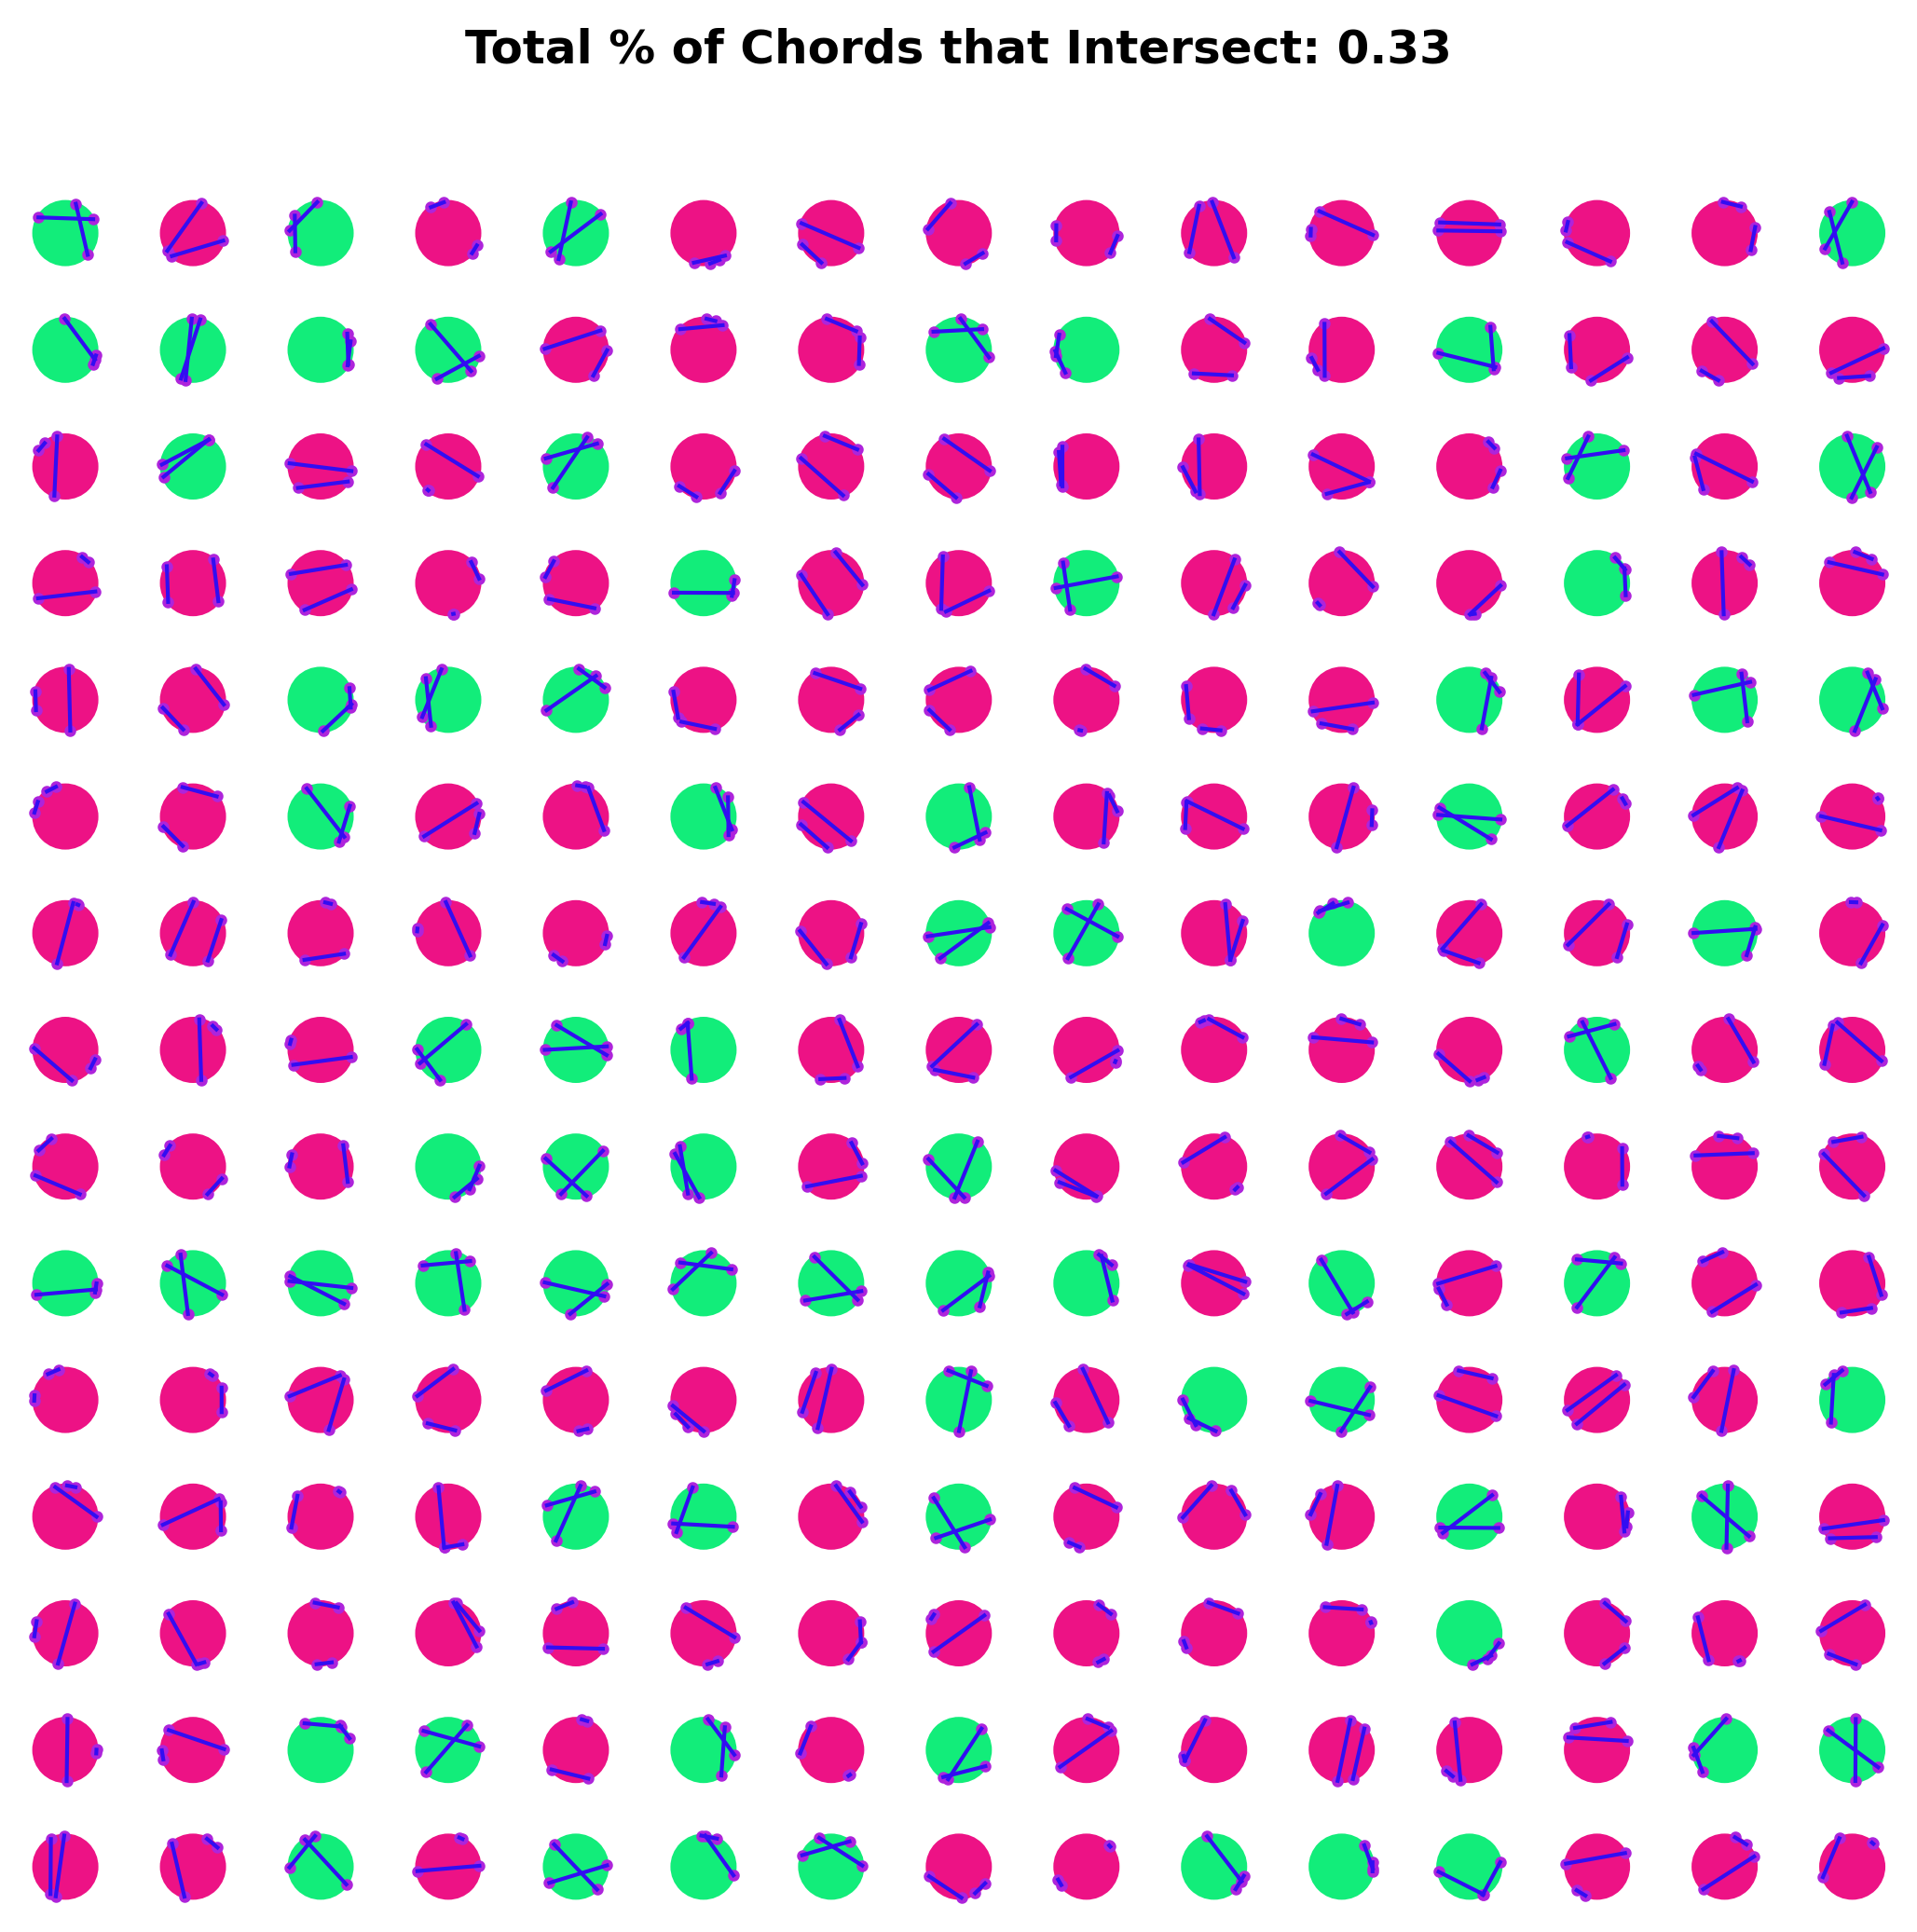
Our simulation generates 10,000 pairs of random chords within a unit circle. For each pair, we determine whether the chords intersect, gradually building a robust empirical estimate of the intersection probability. The process is visualized through an array of 225 mini-circles, each representing a single trial.
The visualization employs a color-coded system: green circles indicate intersecting chords, while pink circles represent non-intersecting pairs. Purple dots mark the chord endpoints, and blue lines trace the chords themselves. This intuitive representation allows for immediate visual comprehension of the results.
As the trials accumulate, we converge on an empirical probability, offering insight into this geometric phenomenon. This experiment not only demonstrates the power of Monte Carlo methods in solving complex probabilistic problems but also reveals the hidden patterns within seemingly random geometric configurations.
By blending computational techniques with fundamental geometric principles, this simulation provides a tangible exploration of abstract mathematical concepts, bridging the gap between theoretical probability and practical application.
import math
from shapely.geometry import LineString
import random
import matplotlib.pyplot as plt

plt.rcParams['figure.dpi'] = 300

def genPoints(n = 1000, r = 1):
    """
    Generates n random points within a unit circle.
    Returns a list of tuples (x, y) representing the points.
    """
    points = []
    for i in range(n):
        angle = 2 * math.pi * random.random()
        x = r * math.cos(angle)
        y = r * math.sin(angle)
        points.append([x, y])
    return points

def intersectChord(points = None):
    if not points:
        points = genPoints(n = 4, r = 1)
    p1, p2, p3, p4 = points[0], points[1], points[2], points[3]
    ls1 = LineString([p1, p2])
    ls2 = LineString([p3, p4])

    return ls1.intersects(ls2)

def visualize_chords(rows = 10, cols = 10, subs = str):
    points = genPoints(n = 4, r = 1)
    fig, axes = plt.subplots(rows, cols, figsize = (7, 7))
    circle = plt.Circle((0, 0), 1, fill = False)
    counter = 0

    for row in range(rows):
        for col in range(cols):
            points = genPoints(n = 4, r = 1)
            ax = axes[row, col]

            if intersectChord(points):
                circle = plt.Circle((0, 0), 1, color = '#12ED7A', fill = True)
                counter += 1
            else:
                circle = plt.Circle((0, 0), 1, color = '#ED1285', fill = True)

            for (x, y) in points:
                ax.plot(x, y, 'o', markersize = 2, color = '#AE24DB')

            p1, p2, p3, p4 = points[0], points[1], points[2], points[3]
            ax.plot([p1[0], p2[0]], [p1[1], p2[1]], '#320DF2', linewidth = 1)
            ax.plot([p3[0], p4[0]], [p3[1], p4[1]], '#320DF2', linewidth = 1)

            ax.set_xlim(-1.2, 1.2)
            ax.set_ylim(-1.2, 1.2)
            ax.add_artist(circle)
            ax.set_aspect('equal', 'box')
            ax.grid(visible = False, which = 'major', axis = 'both')
            ax.axis('off')
            title = f'Total % of Chords that Intersect: {round(counter/(rows*cols), 2)}'
    plt.suptitle(title, weight = 'bold')
    plt.tight_layout(rect=[0, 0, 1, 0.96])
    plt.show()

def main():
    n = 10000
    count = 0
    for i in range(n):
        if intersectChord():
            count += 1
    subtitle = f'With 10,000 trials, there\'s a {round(count/n, 2)} chance they intersect'
    visualize_chords(rows = 15, cols = 15, subs = subtitle)

if __name__ == "__main__":
    main()
Theoretical: Say you draw a circle and choose two chords at random. What is the probability that those chords will intersect?
2 points are needed to create a chord 4 points are needed to create two chords Of the 4 randomly selected points, you can have 3 chord combinations Of the 3 chord combos, only 1 intersects The probability calculation:
$P(x) = \displaystyle\frac{1\times \text{Total Chord Combinations in the Circle}}{3\times \text{Total Chord Combinations in the Circle}} = \displaystyle\frac{1}{3} \approx 0.33$
This calculation shows that the probability of two randomly chosen chords intersecting in a circle is approximately 0.33 or 1/3.